

Read your reports
See profit, expenses, returning customers, lead sources, and call activity for your shop.
Reports shows what your shop earned and spent, who comes back, and where leads come from. Click Reports in the sidebar. The tabs you see depend on your permissions.
| Tab | What it shows | You need |
|---|---|---|
| Profit | Revenue, costs, profit, and margin | View margin reports |
| Expenses | Every expense, with filters | View expenses |
| Customers | Repeat visits, revenue by make, busy times | View reports |
| Leads | Where leads come from and where they end up | View reports |
Owners and Admins see all four. Technicians see none by default. View cost reports adds the cost breakdown to Profit, and View compensation adds each person's pay.
Profit
Pick a period at the top right: This month, Last month, This quarter, Last quarter, This year, or Last year. The default is This month.

- Revenue is what customers paid for the work, after discounts and before tax, minus refunds.
- Costs adds up Materials, Labor, Card fees, and Expenses. Without View cost reports, you see Revenue, Profit, and Margin only.
- Profit by month charts the 12 months ending with the last month of the period, and stops at the current month.
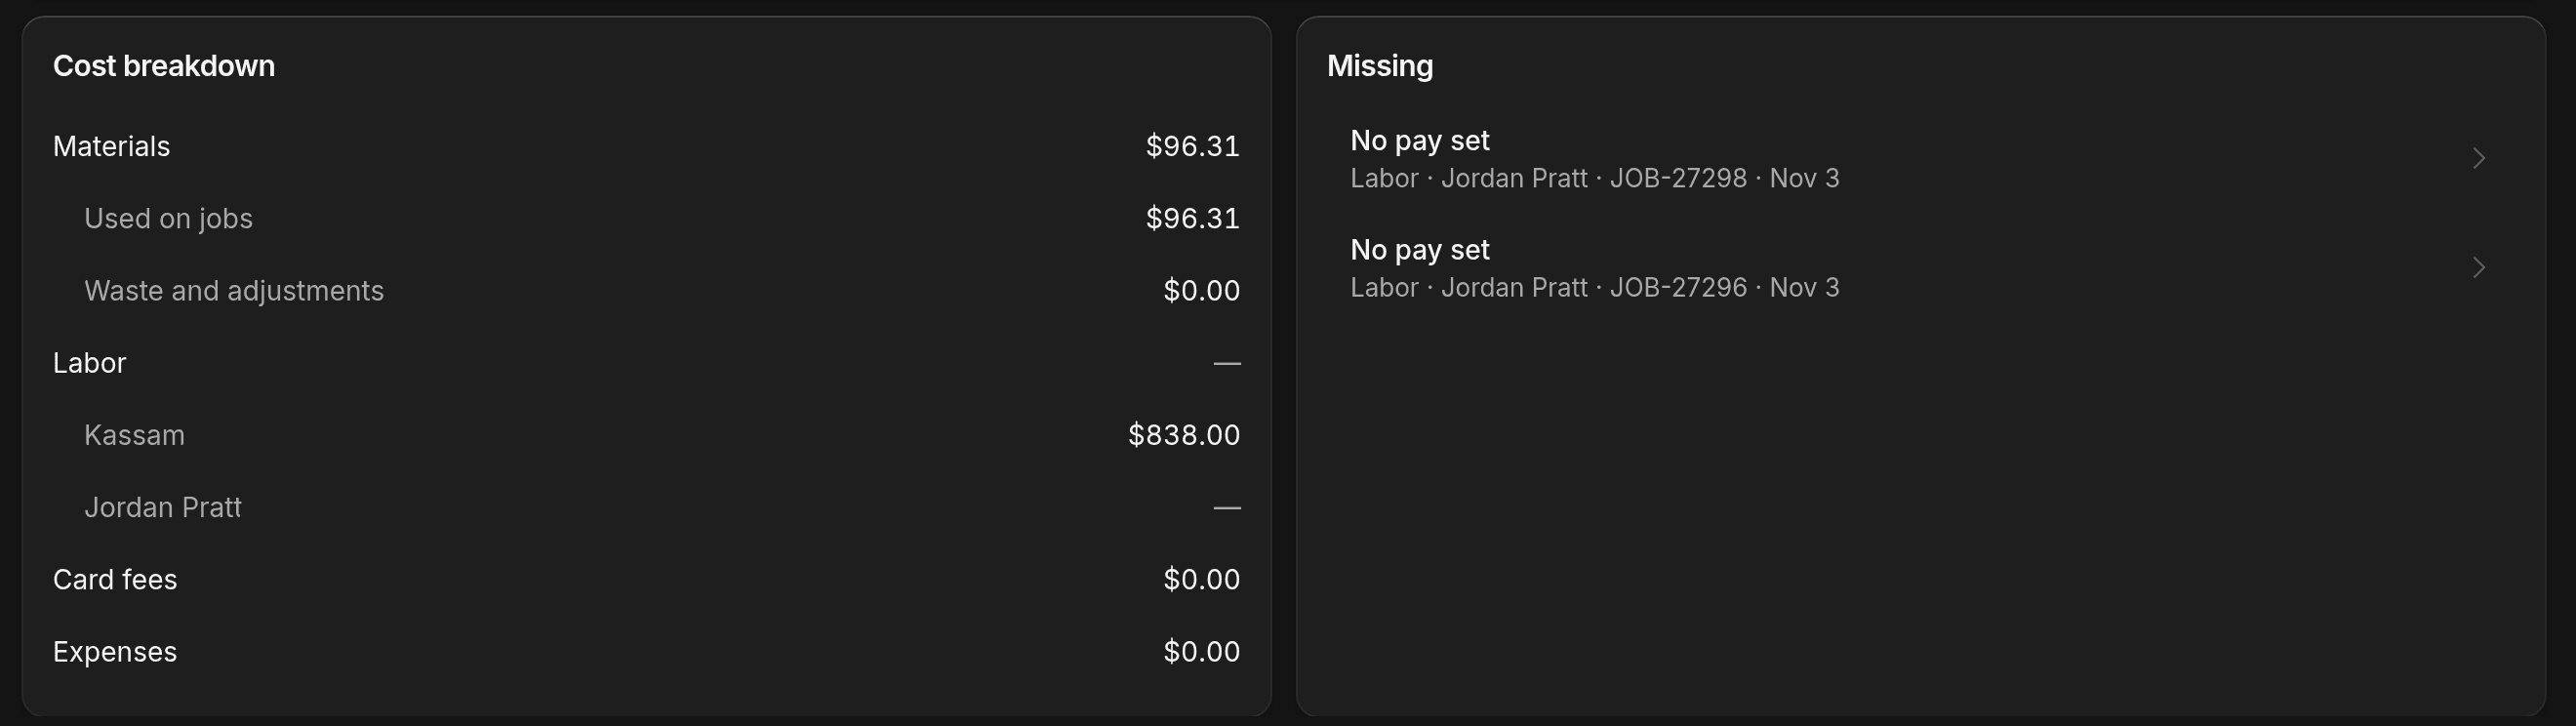
- Cost breakdown splits costs into the same four groups, with each expense category under Expenses.
A dash means ShopWrk can't work the amount out yet, and it never counts it as $0. The Missing card lists what to fix, such as No price for stock used or Expense missing details. Click a row to open the job or record.
Expenses
The Period menu works here too. Filter by Category, Job, or Source: Typed, Receipt, ShopWrker, or Repeating. To add one, click Add expense, or click Upload receipts and review them. Both need Add and edit expenses.
To set up rent or a software subscription, click Repeating expenses. Click Add repeating expense, set Amount, Repeats (Weekly, Monthly, or Yearly), First date, and an optional End date.
Customers
Customers has four charts, and they don't use the period menu.
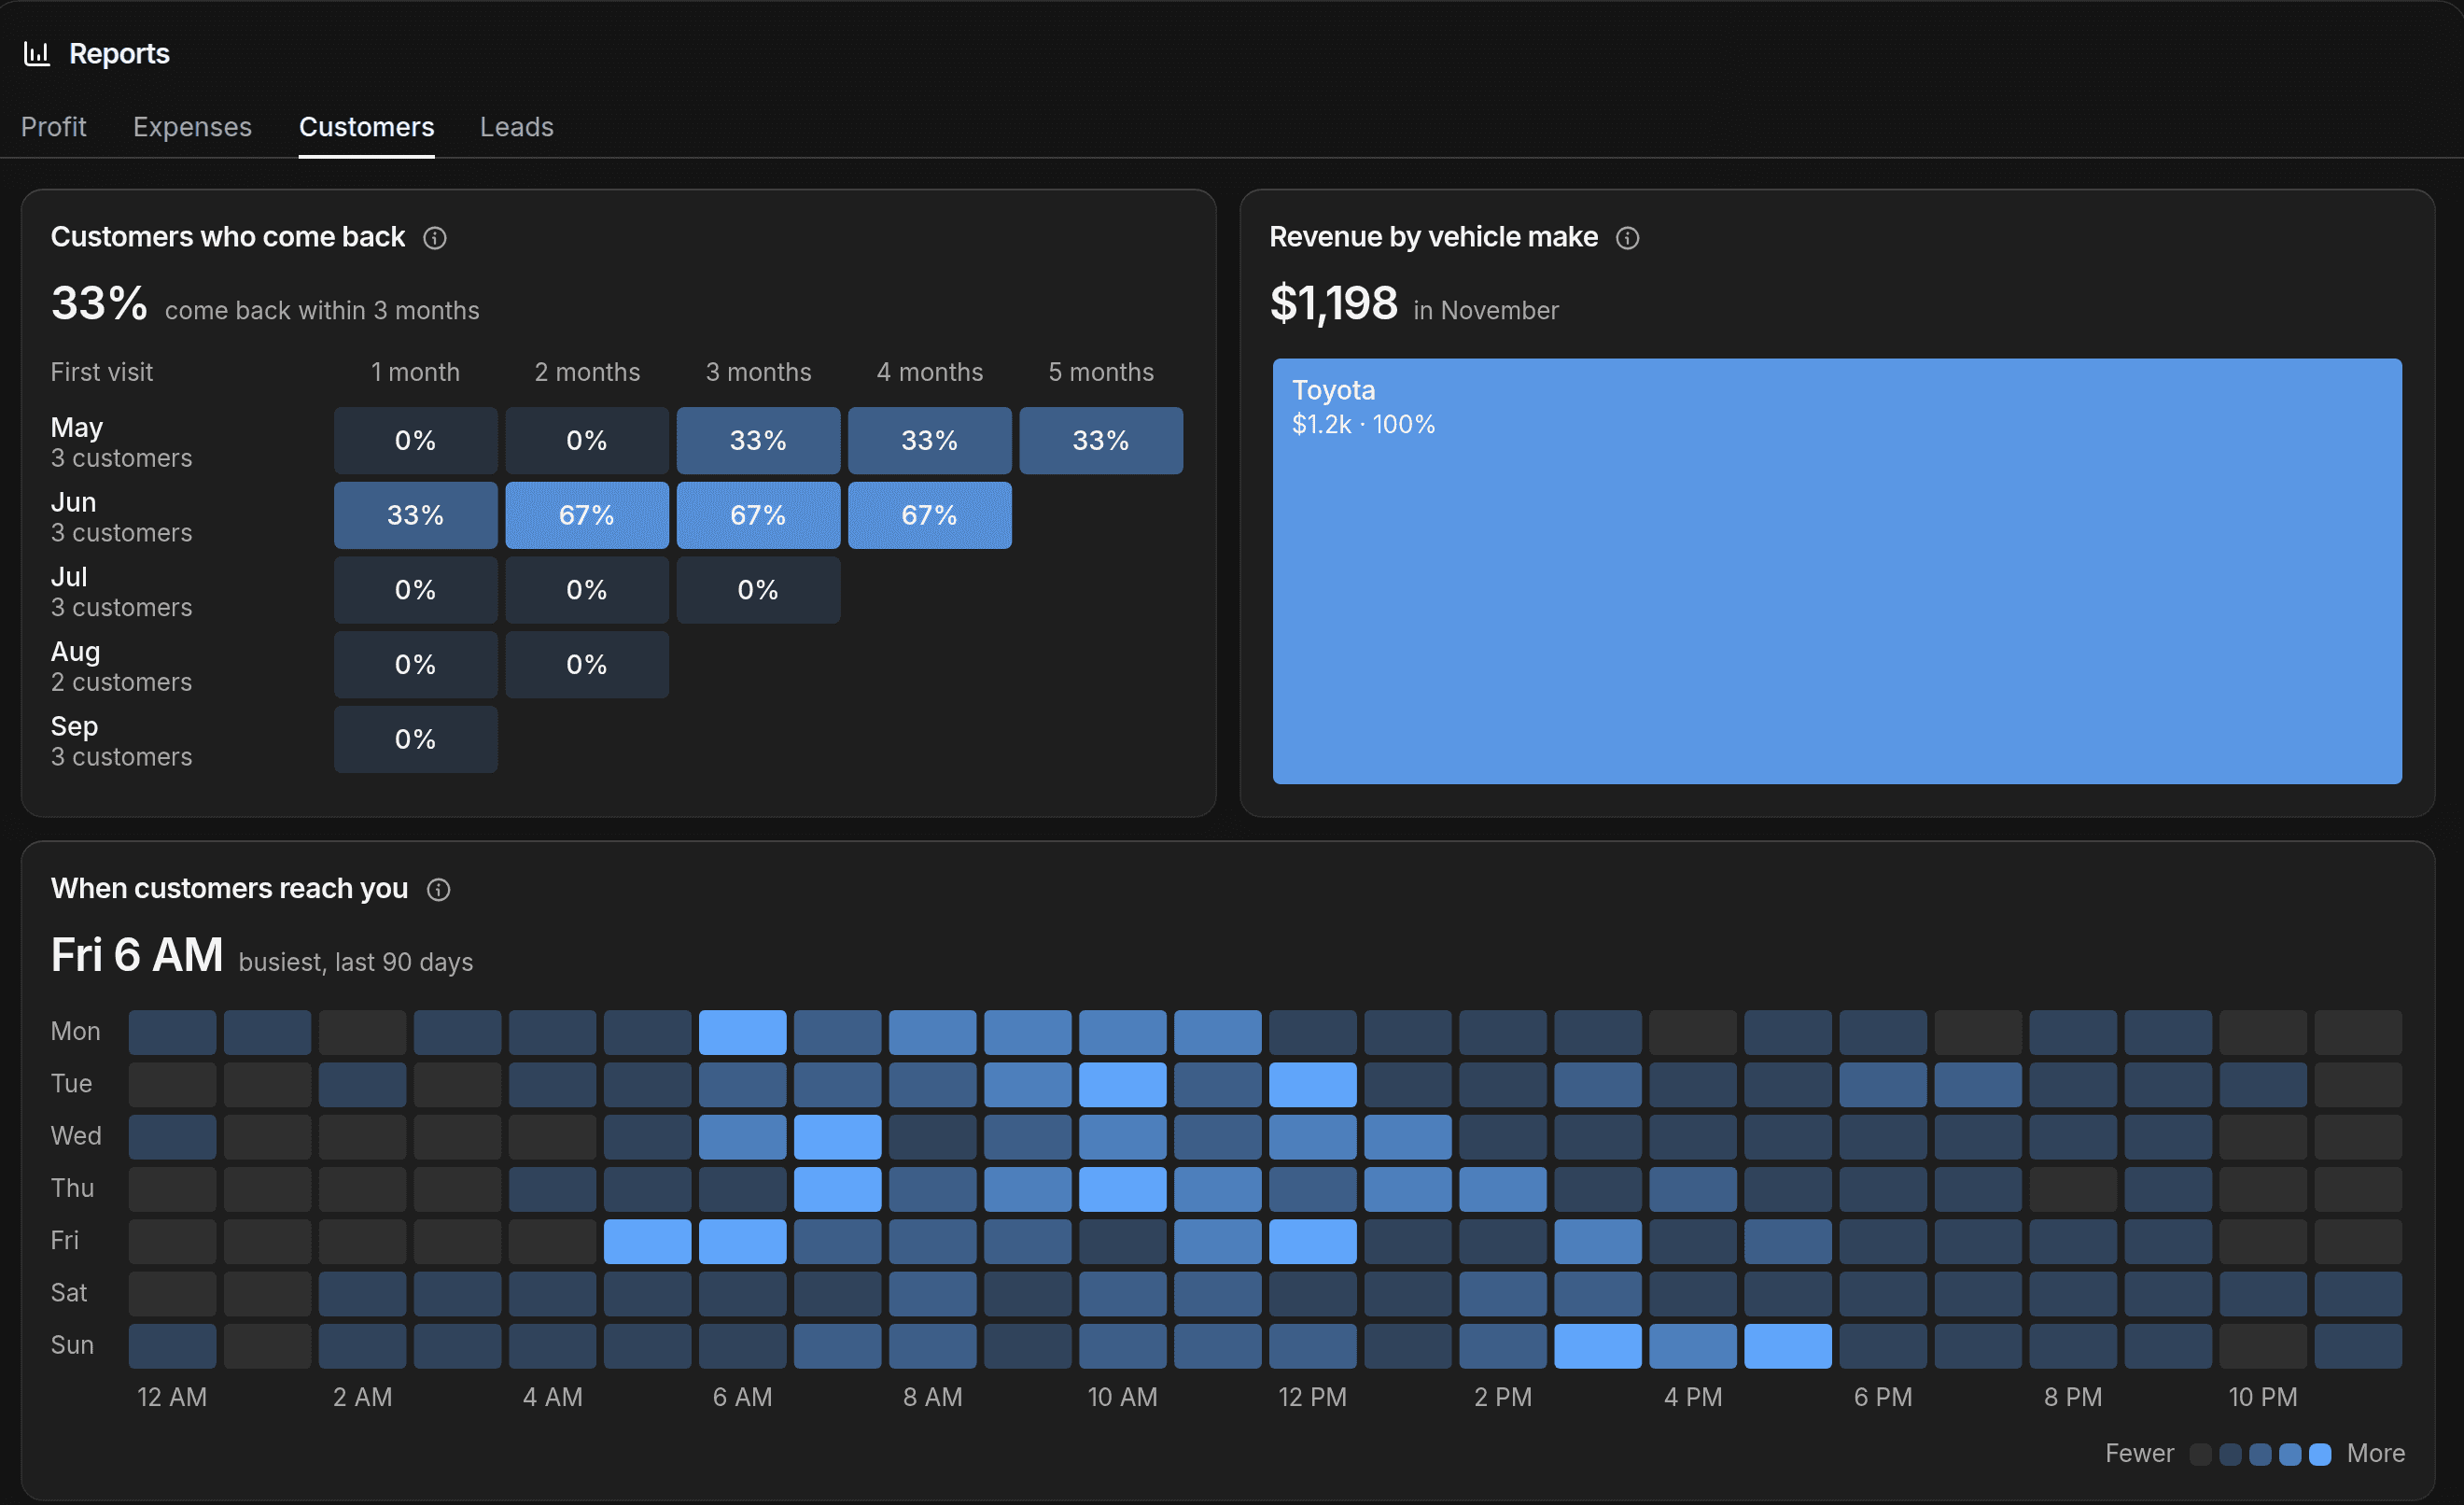
- Customers who come back. Customers are grouped by the month of their first completed job. The grid shows how many came back for another job within 1 to 5 months. A column appears only after every customer in that month has had the full time to come back.
- Revenue by vehicle make. This month's revenue, by the make of the car it was for. A refund lowers the make it was for.
- When customers reach you. Calls and messages from customers by weekday and hour, over the last 90 days.
- Busy days. Jobs completed each day over the last 12 months.
Leads
Leads also ignores the period menu.
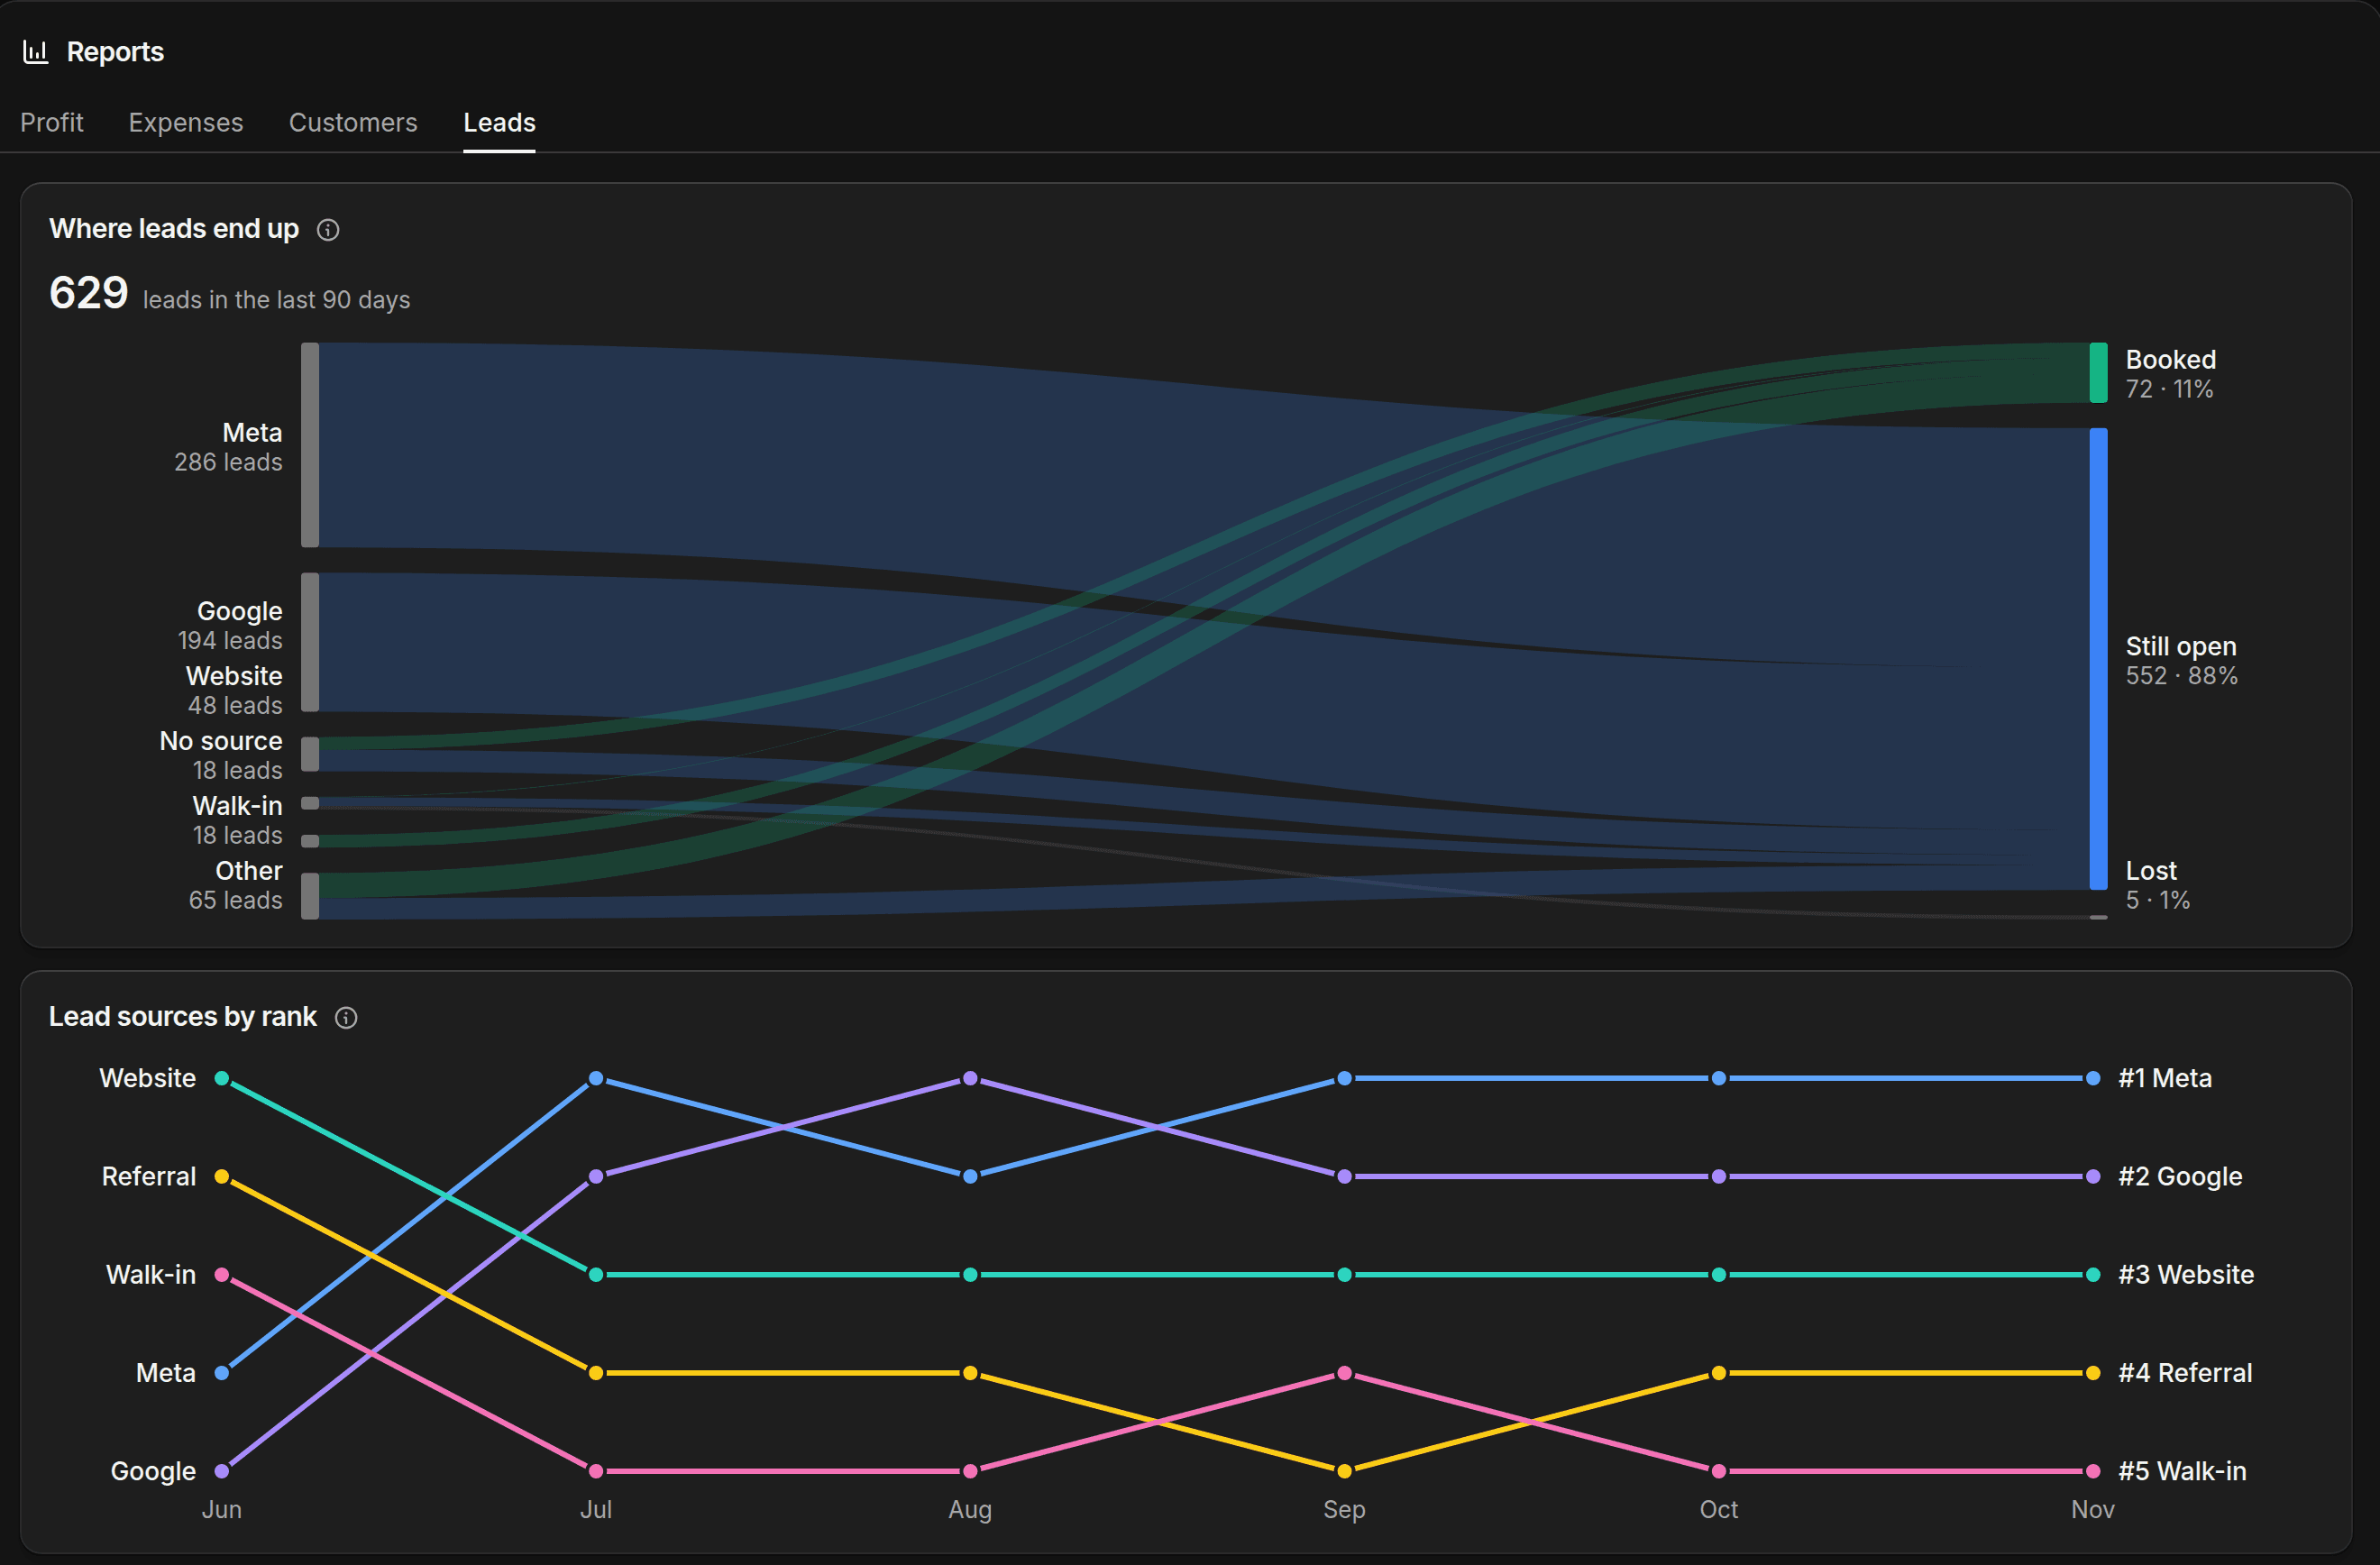
- Where leads end up. Deals created in the last 90 days, by source. Booked is a won deal, Lost is a lost or archived deal, and Still open is the rest.
- Lead sources by rank. Which source brought the most new deals in each of the last 6 months.
Each lead is a deal, and its source is the Source on the deal. Deals with no source show as No source.
Call analytics
Call analytics is a separate page. Open Settings > Call Flow and click Call analytics. You need View call history.
Choose 7 Days, 30 Days, or 90 Days. You get Calls, Average call, Missed, and Inbound and outbound, plus Call volume by day, Call outcomes, and Team performance, which shows the calls each person handled.
Export
The report pages have no export button. To download your customers, jobs, invoices, estimates, and services as CSV files, see Import and export your data. Only the owner can export.